How Monitor feature works
The connector checks that the protected device still answers on its own network and measures latency and packet loss. Where you read the chart in the Console and when the alert fires.
The Monitor checks that the protected device is still reachable on its own network, measuring latency and packet loss.
How it works
The connector keeps checking the protected device, the one whose address you declared in the DR configuration, on the customer network and on the VLAN set on the DR. From those checks it works out the average latency and the percentage of lost answers, then sends both values to the Sefthy cloud.
The check does not rely on ping, so it works even when a local firewall or a wrong configuration stops the device from answering. If the machine is still attached to the network, the monitor sees it.
Where you read it
Open the DR page and look at the Connector tile in the header. Next to the status you find the chart icon. Click it and Device Monitor opens with the last 8 hours. Interruptions longer than three minutes are highlighted, so you can see at a glance when the device dropped off the network.
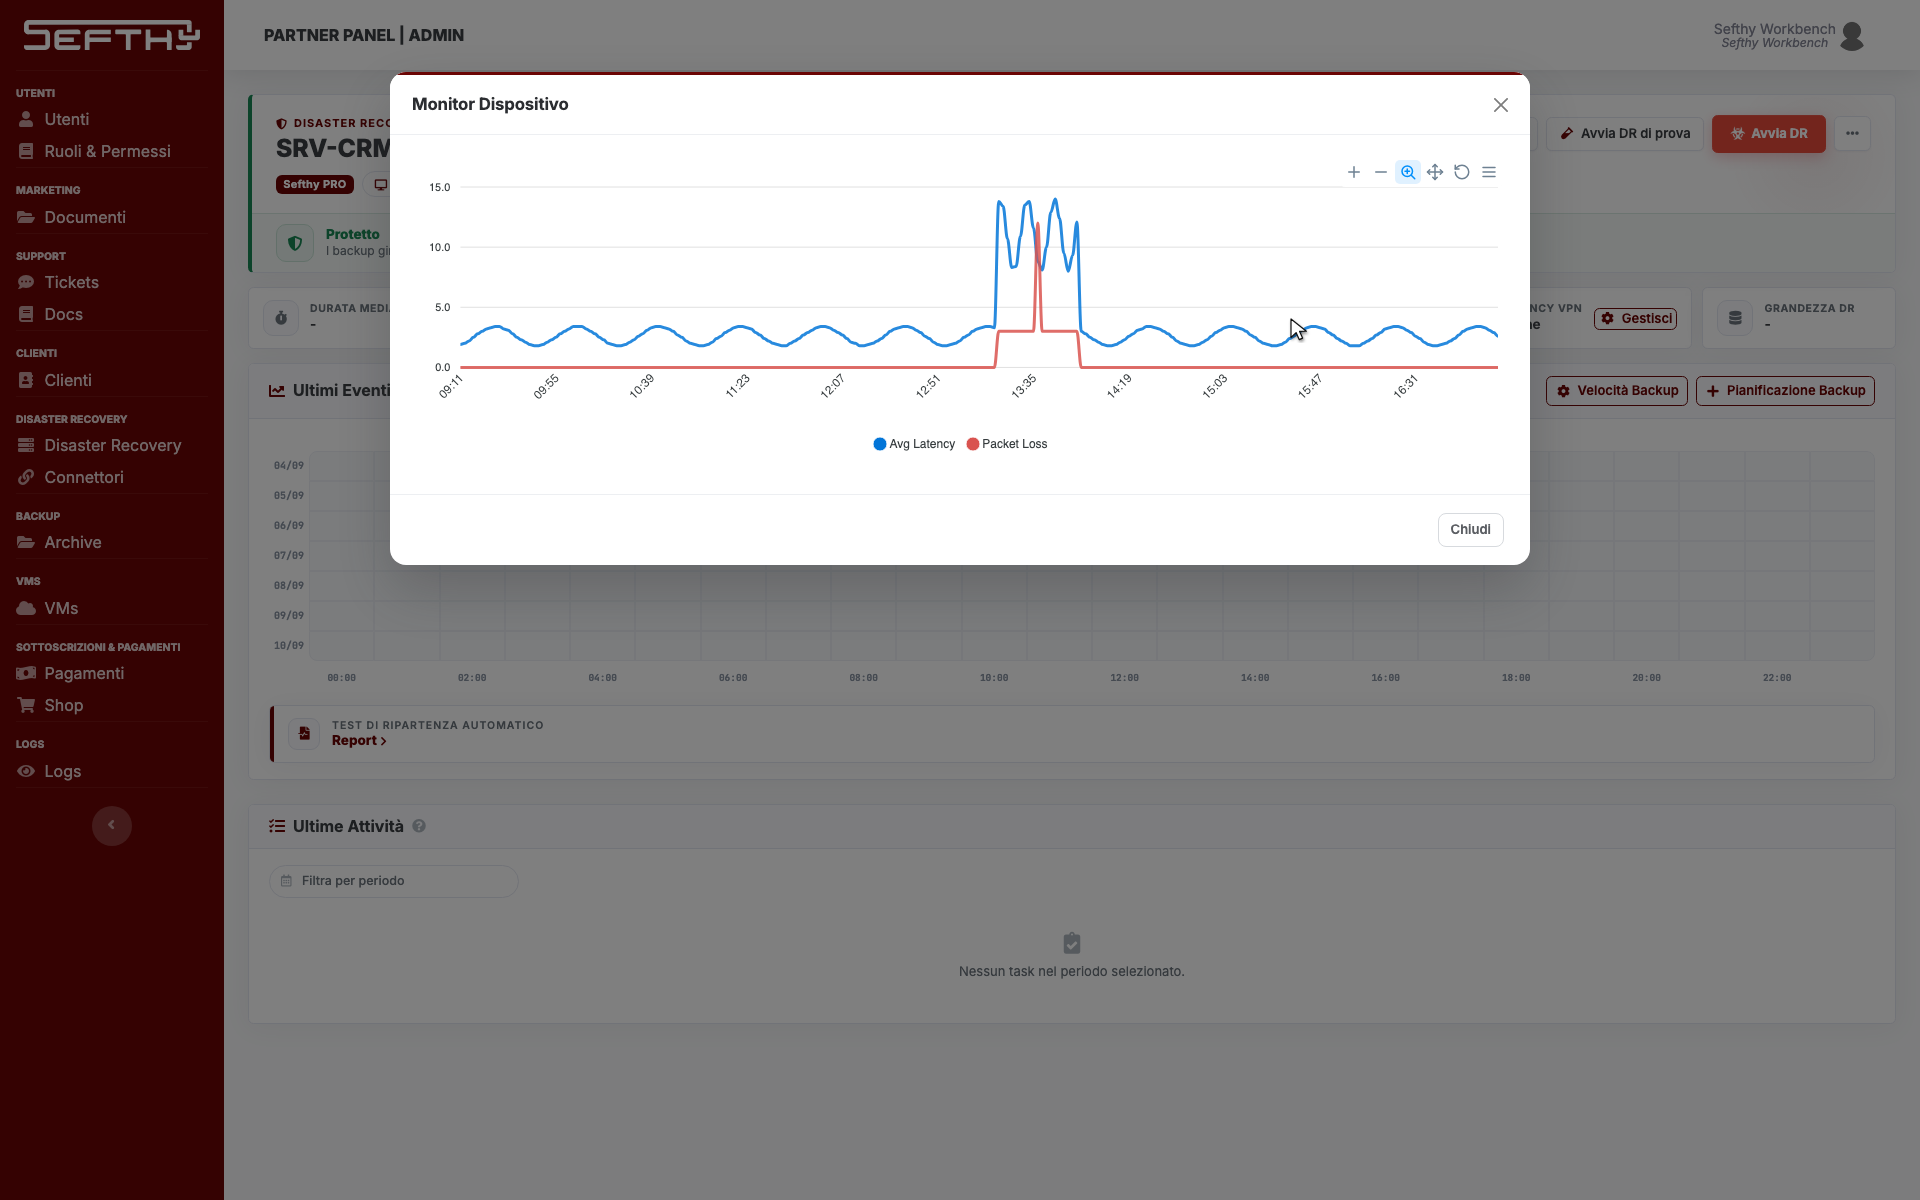
An alert badge appears on the icon when, in the last 8 hours, the connector went offline, packet loss was detected or latency rose above its average. Hover over it to read which of the three happened.
On which plans
Proactive monitoring is included in the Sefthy TRIAL and Sefthy PRO plans. You find it as the “Proactive Monitoring” row of the plan comparison table, on the DR activation page.
The email alert
When packet loss goes over 70% for more than three minutes the Packet loss over 70% for more than 3 minutes alert fires. It reaches the users of your company who turned that tile on in their profile, and it does not fire if you muted the alerts of that DR.
If the device stops answering, it is time to consider starting the Disaster Recovery. See Notifications Settings to turn the alert on or mute a DR.